Pivot tables are a powerful feature in Microsoft Excel that allows you to analyze large amounts of data quickly and easily. They allow you to summarize data from multiple rows and columns into a single, compact table that can be used to answer questions and make data-driven decisions. In this blog, we will show you how to create pivot tables in Excel, including what pivot tables are, how to prepare your data, and how to create, format, and use pivot tables.
What are Pivot Tables in Excel?
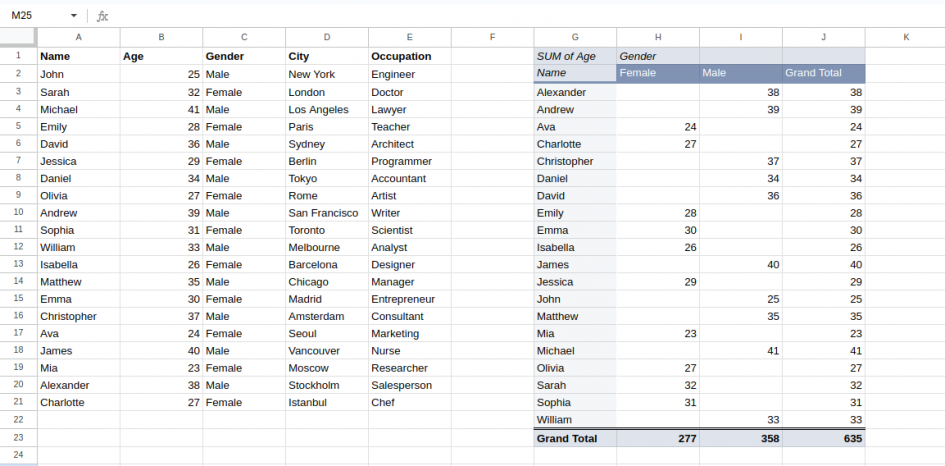
A pivot table is a data summarization tool in Excel that allows you to aggregate and analyze data from multiple rows and columns. It helps to simplify and consolidate large amounts of data into a more manageable format. Pivot tables are used to extract meaningful insights and patterns from your data. They are an excellent tool for creating reports and dashboards that can be used to communicate critical information to stakeholders.
Preparing Your Data for a Pivot Table
Before creating a pivot table, it is essential to prepare your data to make it suitable for analysis. Here are a few tips for preparing your data:
- Organize Your Data into Rows and Columns: Pivot tables are designed to work with data organized into rows and columns. Ensure your data is arranged in a tabular format, with each column representing a different data field and each row representing a different record.
- Remove Duplicates: Pivot tables work best with data that is unique and has no duplicates. Duplicate data can skew your results and create incorrect or misleading insights.
- Ensure Data is Clean: Clean data is essential for accurate pivot table analysis. Check for errors, missing values, and outliers and remove or correct them as needed.
- Use Column Headings: Make sure each column in your data set has a descriptive heading. These headings will be used as field names in your pivot table, making it easier to understand the data being analyzed.
Creating a Pivot Table in Excel
To create a pivot table in Excel, you will need to start by selecting your data. Here are the steps to create a pivot table:
Select Your Data: Highlight the data you want to include in your pivot table. You can either select a specific range of cells or an entire data set.

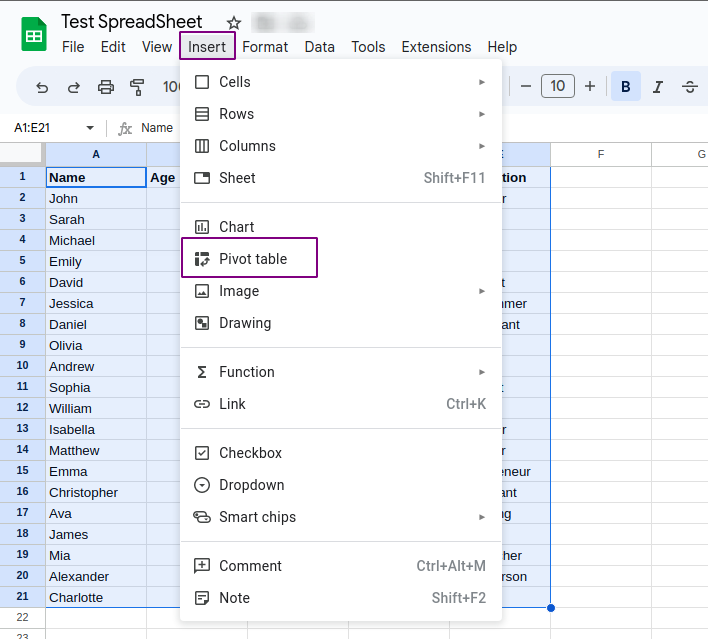
Choose the “Insert” Tab: From the “Insert” tab on the ribbon, select the “PivotTable” option.

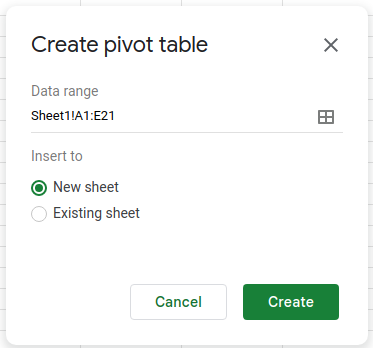
Specify the Data Range: In the “Create PivotTable” dialog box, select the data range for your pivot table. If you have already selected your data, Excel will automatically fill in the range for you.
Choose the Location for Your Pivot Table: Next, specify the location for your pivot table. You can either create a new worksheet for your pivot table or place it in an existing one.
Create Your Pivot Table: After specifying the location for your pivot table, click the “OK” button to create your pivot table.

Formatting and Using Your Pivot Table
Once you have created your pivot table, you can format it to meet your needs. Here are a few tips for formatting and using your pivot table:
Add Fields to Your Pivot Table: In the “PivotTable Fields” pane, select the fields you want to include in your pivot table. You can add multiple fields to the “Rows” and “Columns” sections to create multi-level pivot tables.
Choose Data Fields: You can also choose data fields, such as “Sum,” “Count,” or “Average,” to summarize your data. Select the data field you want to use and drag it to the “Values” section in the “PivotTable Fields” pane.
Apply Filter: You can use filters to refine your pivot table data. For example, you can filter data based on specific criteria, such as date ranges or particular values. To apply a filter, select the field you want to filter and click on the filter icon in the “PivotTable Fields” pane.
Group Data: You can group data in your pivot table to create custom categories. For example, you can group dates by month or quarter. To group data, right-click on the field you want to group and select the “Group” option.
Format Your Pivot Table: You can format your pivot table to make it more readable and visually appealing. For example, you can change the font, add borders, and apply conditional formatting to highlight specific data points.
Refresh Your Pivot Table: If your data changes, you can refresh your pivot table to reflect the updated data. To refresh your pivot table, right-click on it and select the “Refresh” option.
Conclusion
Pivot tables are a powerful tool in Excel that can help you summarize and analyze large amounts of data quickly and easily. Whether you are working with sales data, customer data, or any other type of data, pivot tables can help you extract meaningful insights and communicate your findings to stakeholders. By following the steps outlined in this blog, you can create pivot tables in Excel, format them to meet your needs and use them to answer important questions and make data-driven decisions.

Leave a Reply